Monitoring OpenWRT WiFi through SNMP

I recently acquired an old Aruba AP-105. Unlike the closely related IAP-105, the AP-105 is completely useless without an Aruba controller. Luckily however, with some effort, the device can be flashed with OpenWRT. With even more luck, I even got a colleague to do the hard work of flashing U-boot to the onboard SPI for me.
Though lacking modern WiFi standards such as 802.11ac and 802.11ax, the device does offer 5GHz 802.11n and is perfectly adequate for a wide range of applications. As I have no real need for additional access points in my home however, I mounted the AP-105 in my shed and set it up to connect as a client to my main access point in the house. I am planning to connect the shed with fiber some time, but I’m still waiting for the necessary parts to arrive. Using the AP-105 as a wireless bridge immediately provides me with internet access in the shed and requires a lot less digging and drilling.
Monitoring⌗
As I’m a huge nut for monitoring things, I wanted to monitor the stability of the wireless connection between the shed and my house.
Even though OpenWRT offers some pretty nice real-time graphs on wireless signal strength and bitrate, these statistics are not natively available over SNMP.
Fortunately, it is pretty easy to have snmpd execute your own scripts.
I wrote the following ‘scripts’, if you can even call them that. Although this post specifically refers to the Aruba AP-105, this monitoring setup should work on any OpenWRT device with wifi, though in some instances may require modifying the wifi interface names.
#!/bin/sh
#wifibitrate.sh
iwinfo $1 info |grep 'Bit Rate' | tr -s ' ' | cut -d ' ' -f4
#!/bin/sh
#wifisignal.sh
iwinfo $1 info |grep 'Signal:' | tr -s ' ' | cut -d ' ' -f3
They are basically oneliners in a shell script.
I tried to directly execute the oneliners from snmpd, but wrapping them in a script ultimately proved to be more straightforward.
The scripts call iwinfo to obtain information on the current state of a wifi interface.
From this input, they extract a single line each and then cut these lines down until only the reported value remains.
To enable execution of the scripts through snmpd, they have to be configured in /etc/config/snmpd as follows:
config exec
	option name 'wlan0bitrate'
	option prog '/opt/wifibitrate.sh'
	option args 'wlan0'

config exec
	option name 'wlan0signal'
	option prog '/opt/wifisignal.sh'
	option args 'wlan0'
As you may have noticed, the scripts take an argument to select the wireless interface for which to extract the statistics.
This enables you to extend the config in /etc/config/snmpd to additional interfaces without having to duplicate the scripts themselves.
Graphing with LibreNMS⌗
I have a LibreNMS instance that periodically polls my devices through SNMP and puts the information it receives in pretty graphs.
By default LibreNMS identifies and collects a lot of information for graphing, but it won’t natively find my custom additions.
We can, however, explicitly specify a custom SNMP OID for it to poll and graph in the LibreNMS device settings.
When leaving the default config exec entry shipped by OpenWRT in place, the additional values are available at UCD-SNMP-MIB::extOutput.2 and UCD-SNMP-MIB::extOutput.3 respectively.
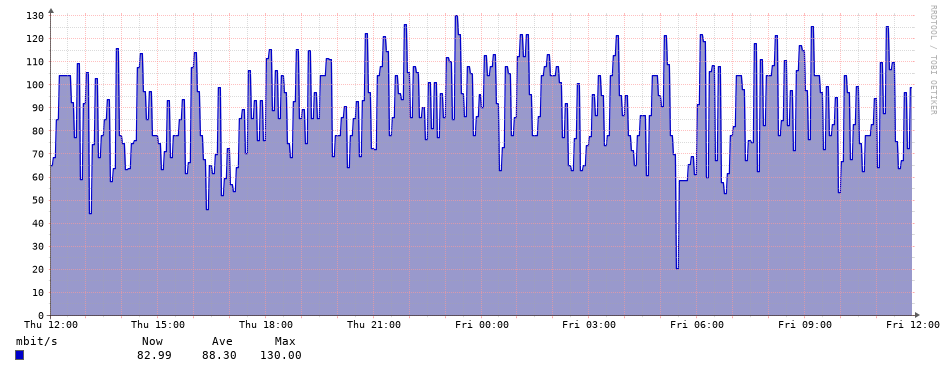
Entering these OIDs into LibreNMS and letting some time pass then yields the following graphs: