OpenWRT Dsl Monitoring
I recently set up an OpenWRT device as a modem on a KPN DSL connection. Fittingly, the device running OpenWRT is a KPN Experiabox V8 which KPN provided their subscribers with up until a couple of years ago. While the device is quite crippled when running the stock firmware, OpenWRT transforms the device into a quite capable modem and router.
Having configured the appropriate credentials (user: MA-CA-DD-RE-SS@internet pass: kpn), the PPPoE connection came up immediately, automagically including DHCPv6-PD.
As I’ve seen the attainable speeds over DSL fluctuate over time on other connections I’m managing, I wanted to set up monitoring on the DSL statistics.
I previously came across this script which extracts and graphs a lot of data, but uses Matlab (blegh) and is difficult to integrate into my existing monitoring infrastructure.
I therefore turned to Prometheus, my go-to monitoring tool which is available on OpenWRT through the prometheus-node-exporter-lua package.
Though this package natively allows monitoring traffic through all interfaces including the DSL interface, I want to monitor the attainable and actual data rate over DSL.
Though I could wite my own collector in lua, I decided to utilize the prometheus-node-exporter-lua-textfile collector.
This collector includes the contents of all files ending in .prom in the /var/prometheus folder.
The contents of these files should be in the Prometheus metrics format.
I wrote a very simple script that greps and cuts the DSL info output from the dsl_control script and formats it appropriately for parsing by Prometheus:
#!/bin/sh

STATS=$(/etc/init.d/dsl_control status)

echo "$STATS" | echo 'openwrt_dslstats{value="Downstream_rate"}' $(fgrep 'Data Rate:' | cut -d ':' -f3 | cut -d ' ' -f2) > /var/prometheus/dslstats.prom
echo "$STATS" | echo 'openwrt_dslstats{value="Upstream_rate"}' $(fgrep 'Data Rate:' | cut -d ':' -f4 | cut -d ' ' -f2) >> /var/prometheus/dslstats.prom
echo "$STATS" | echo 'openwrt_dslstats{value="Downstream_max_rate"}' $(fgrep '(ATTNDR):' | cut -d ':' -f3 | cut -d ' ' -f2) >> /var/prometheus/dslstats.prom
echo "$STATS" | echo 'openwrt_dslstats{value="Upstream_max_rate"}' $(fgrep '(ATTNDR):' | cut -d ':' -f4 | cut -d ' ' -f2) >> /var/prometheus/dslstats.prom
The script is executed every minute through cron.
This results in the following output in /var/prometheus/dslstats.prom:
openwrt_dslstats{value="Downstream_rate"} 63.428
openwrt_dslstats{value="Upstream_rate"} 23.120
openwrt_dslstats{value="Downstream_max_rate"} 70.588
openwrt_dslstats{value="Upstream_max_rate"} 28.357
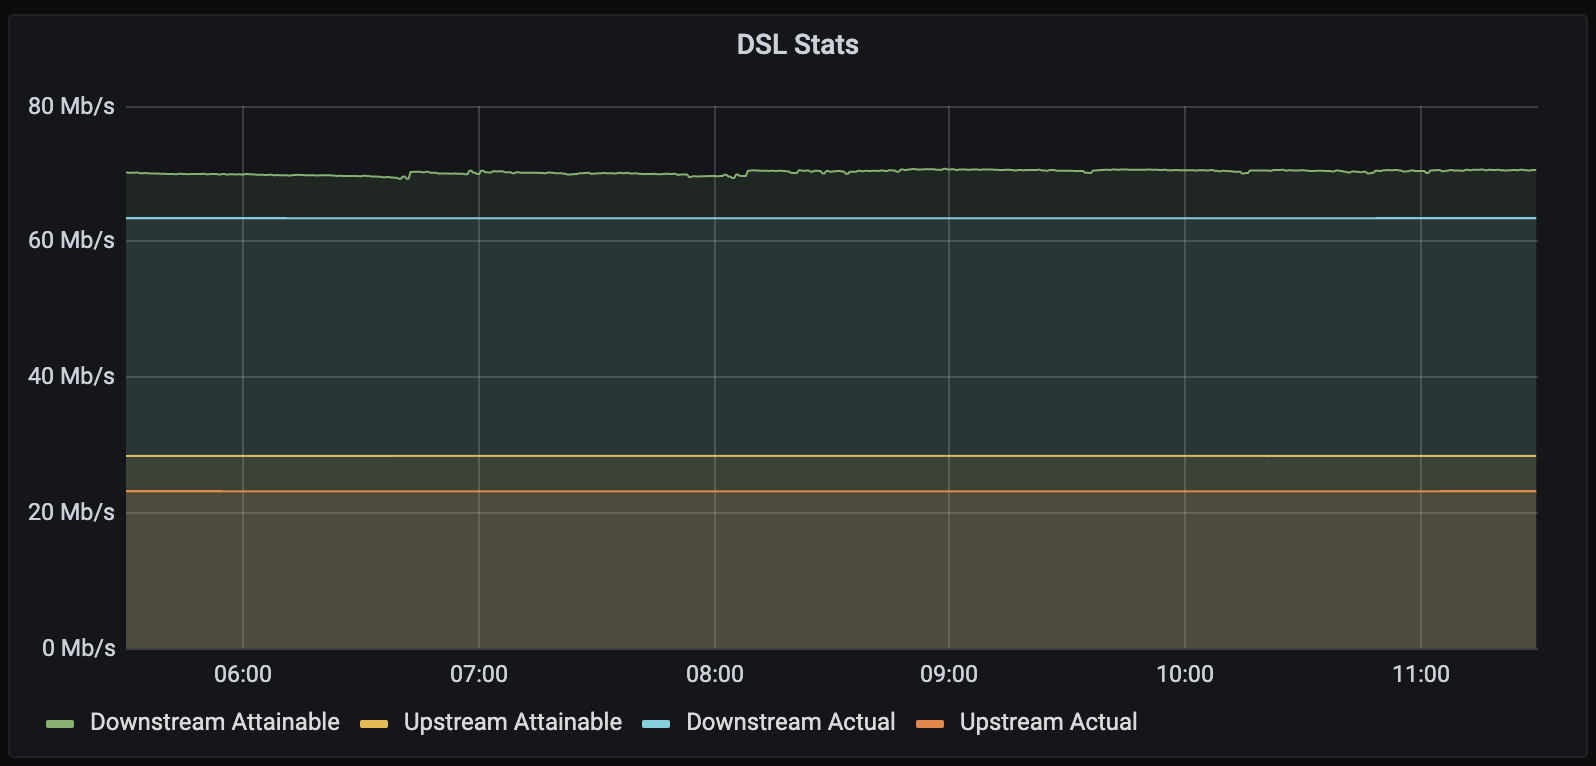
Having configured everything as above and with the metrics collected by my Prometheus server I can now make pretty graphs in Grafana: